Get insights on PostgreSQL data with Azure Sentinel
… with the help of Elastic Logstash

Introduction
Microsoft’s cloud-native SIEM Azure Sentinel provides intelligent security analytics at cloud scale for your entire enterprise. Azure Sentinel makes it easy to collect security data across your entire hybrid organization from devices, users, apps and servers on any cloud. It uses the power of artificial intelligence to ensure you are identifying real threats quickly and unleashes you from the burden of traditional SIEMs by eliminating the need to spend time on setting up, maintaining, and scaling infrastructure.
Since the product became generally available in the end of September 2019 its capabilities improved even further and the number of built-in analytics rules and data connectors grew substantially. But you still might encounter a challenge or two when trying to tie in legacy applications. In this article we’re going to take a closer look into an application which stores it valuable security alerts inside a PostgreSQL database. We need to dig into the database, pull out the alerts and store them into our Sentinel workspace. Then we can create custom analytics rules to give us proper insights in what kind of authentications are performed towards this application. All we need is a swiss army knife…

Logstash: the swiss army knife for collecting data
If the particular PostgreSQL database would be a cloud database, such as an Azure Database for PostgreSQL, it would’ve been an easy task to retrieve the audit logs through the Azure platform. Microsoft already wrote a document on how to do this. But in this case we don’t need the authentications on the database itself, but the events the application stores inside one of the tables in the database.
The last couple of months I’ve been looking into several ways to import and manipulate data in conjunction with Azure Sentinel / Log Analytics. And a lot of these times Logstash made my shortlist for the tool that could help me out.
What is Logstash?
Logstash is a product made by Elastic and is also part of their “Elastic Stack” which is the next evolution of “ELK” Stack. (Elasticsearch, Logstash & Kibana)
Logstash is an open-source data processing pipeline that is able to collect, parse and transform your logs.
- Log ingestion is done with a multitude of available input plugins.
- Optionally your data can be filtered, parsed and transformed as you wish. Elastic provides a library of available filters for you.
- And lastly it uses an output which puts your data into your favorite “stash”. Elastic would suggest you storing the logs into Elasticsearch for further search and analytics capabilities. But there are also a lot of other output plugins available.

In this particular case we’re going to make use of:
- JDBC input plugin for connecting to our PostgreSQL database and retrieving our relevant data with a specific query.
- Azure Log Analytics Workspace output plugin for connecting to Microsoft’s API’s and storing data inside our (Sentinel) workspace.
Running Logstash inside a Docker container
Since I’m already at war with Virtual Machines I would suggest running Logstash inside a container on your favorite container platform. Elastic provides a pre-built container image and a Helm chart for running it on Kubernetes. Check the download page for all of the possible options.
In this example we’ll be needing several non build-in plugins and modules, so building our own custom Docker container seemed the best approach:
- Base image is used from Elastic
- The Azure Log Analytics Workspace output plugin is installed.
- The JDBC input plugin is already part of the initial installation so we won’t need to install that. But we do need the JDBC driver ‘postgresql-42.2.12.jar’ available from the PostgreSQL website.
- Pipeline config file is placed in the correct directory so that Logstash will automatically start processing this on startup.
Logstash pipeline
Besides the proper input- and output-plugins, we’ll also be needing our pipeline config file. A Logstash pipeline describes the steps that are needed to be executed to input, filter and output the data. Our config looks as follows:
- The input part refers to the JDBC plugin we’ve installed. Here we need to provide a proper connection string and authentication for the database (‘security’) as well as a query to retrieve our relevant data from the table (‘authentications’). Note the schedule on line 19 which indicates that Logstash will be repeatedly running this pipeline with a 5-minute interval. The schedule uses a cron format. is Also note the referred JDBC driver on line 11.
- In this case we won’t be needing a filter to manipulate the data before it’s been sent out to Azure Sentinel.
- Output describes where the data is sent to, in this case an Azure Log Analytics Workspace with its proper id and key.
Please note the SQL query that is part of the input of this pipeline:
SELECT uid, timestamp, event, message, username, ipaddress FROM authenticationsLogstash will by default create a new dataset every time it runs. In this case that means that we’ll be retrieving the same data over and over again. Since we don’t want duplicate data in our workspace, we’ll be using the column tracking feature that is part of this particular JDBC input plugin.

Inside the PostgreSQL database
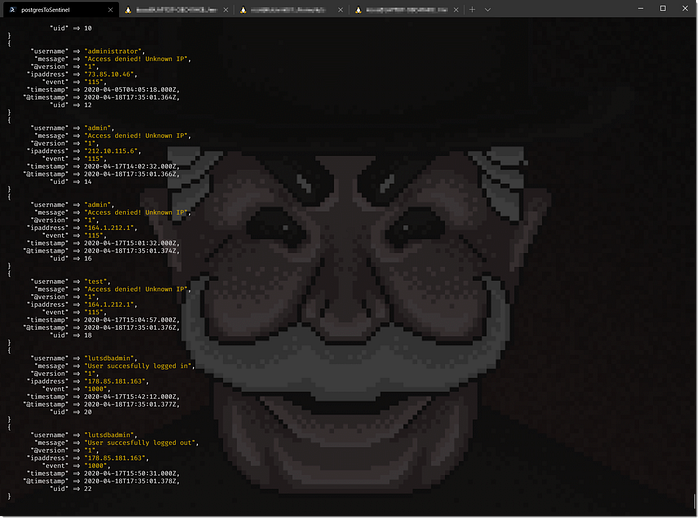
For this article I’ve created a test database with some synthetic data. I’ve create a database called ‘security’ with a table named ‘authentications’ and inserted some authentication activity alerts:

If you want to try on your own as well, please follow these steps I’ve written on how to setup PostgreSQL on Ubuntu and create some synthetic data yourself.
Building and running the container
Once all of the files are in place we can built the container. If you want to give it a try yourself, please download these files from my Github repository and use the following command to build the container:
docker build -t logstash-postgres-to-sentinel .Run the container locally with:
docker run -i -t logstash-postgres-to-sentinelAfter Logstash is started you’re greeted by a few warnings unfortunately. Apparently these have something to do with a specific version of Java runtime Elastic uses in the base image. Also Elastic has chosen to implement Elasticsearch functionality inside the base image. Which is understandable of course but since we won’t be using Elasticsearch we’ll have to accept these warnings as well.
I might look into a custom container image based on stock Ubuntu later. That way we should be able to get rid of these alerts. For now we can just safely ignore these…
Oh data where art thou?
After a short while we should see some data passing by on the screen representing our output towards Azure Sentinel:
Ok now lets use a simple KQL query to see if we can see the data in Sentinel as well:
postgreSQLauthentications_CL
| project TimeGenerated, Message, username_s, IPAddress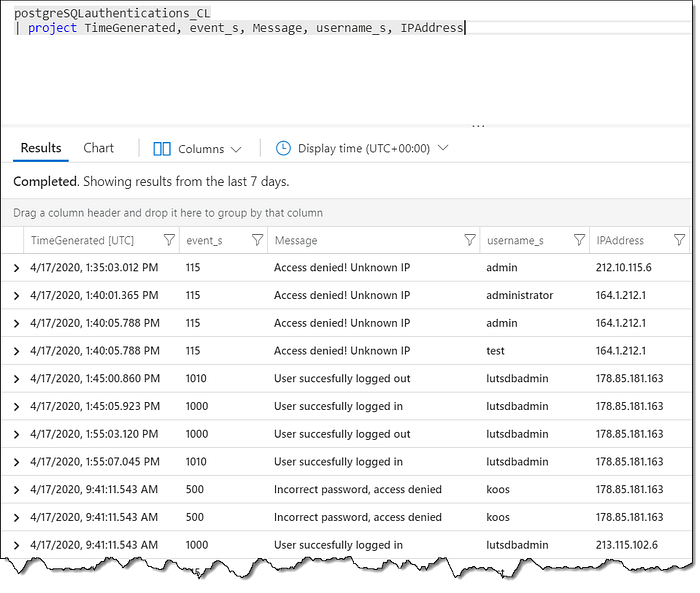
BOOM! It works!
Normally this application will generate new authentication events and add them to the database while time passes. But since we’re using synthetic data here we’ll need to insert some new lines into PostgreSQL ourselves.
Lets see if Logstash will pick them up. This is also a nice test so see if Logstash doesn’t import all of our data again on the next 5 minute interval.
INSERT INTO authentication(timestamp, event, message, username, ipaddress) VALUES('2020-04-18 11:15:50', '500', 'Incorrect password, access denied', 'koos', '178.85.181.163');INSERT INTO authentication(timestamp, event, message, username, ipaddress) VALUES('2020-04-18 11:16:02', '1010', 'User succesfully logged in', 'lutsdbadmin', '178.85.181.163');INSERT INTO authentication(timestamp, event, message, username, ipaddress) VALUES('2020-04-18 11:31:31', '1000', 'User succesfully logged out', 'lutsdbadmin', '178.85.181.163');INSERT INTO authentication(timestamp, event, message, username, ipaddress) VALUES('2020-04-18 16:01:32', '115', 'Access denied! Unknown IP', 'admin', '71.217.91.7');INSERT INTO authentication(timestamp, event, message, username, ipaddress) VALUES('2020-04-18 16:02:43', '115', 'Access denied! Unknown IP', 'administrator', '71.217.91.7');INSERT INTO authentication(timestamp, event, message, username, ipaddress) VALUES('2020-04-18 16:04:57', '115', 'Access denied! Unknown IP', 'test', '71.217.91.7');
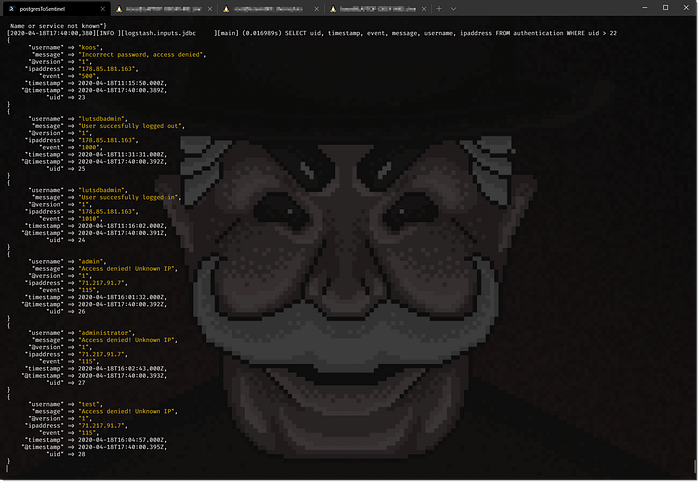
Yes! Logstash does indeed picks up these new lines and ONLY these new lines. Which can also be confirmed within Azure Sentinel:

Sentinel Analytics
Now we have all our relevant data available in Azure Sentinel we can define some analytics rules to detect possible security issues with our application.
Detect possible brute force attempts
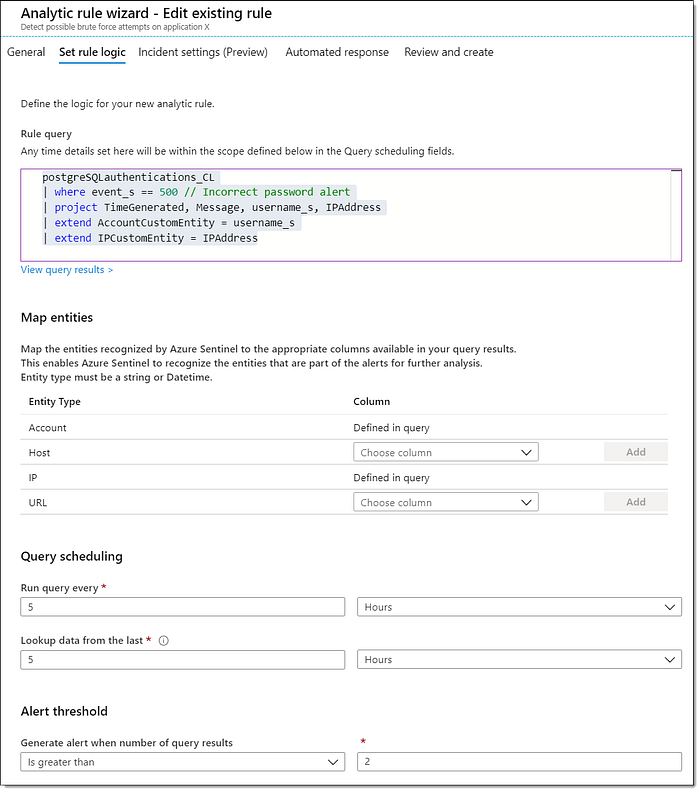
The data we gathered showed some alerts with event id “500” to indicate an incorrect password being used. We could setup an analytics rule to detect these events and trigger an alerts when five of these alerts are triggered within the last 5 minutes:
Rule query:
postgreSQLauthentications_CL
| where event_s == 500 // Incorrect password alert
| project TimeGenerated, Message, username_s, IPAddress
| extend AccountCustomEntity = username_s
| extend IPCustomEntity = IPAddress
Run query every: 5 minutes
Lookup data from the last: 5 minutes
Generate alert when number of query results is greather than 5
Data, data, data
There’re obviously many different scenario’s on how to use the PostgreSQL integration thru Logstash. It all comes down to what you want to protect inside your organization and of course what data is available to you to base your analytics logic on.
Logstash appeared to be a valuable asset (again) to help tying different data sources together. There’re also many other Azure related input- and/or output-plugins available (i.e. Azure blog storage and Azure Event Hubs) which give this mighty tool almost limitless possibilities!
This will probably not be the last time I wrote something about Logstash. 😉
— Koos Goossens